
TokenTrace CLI
Local-first AI CLI usage analytics for developers and coding agents.
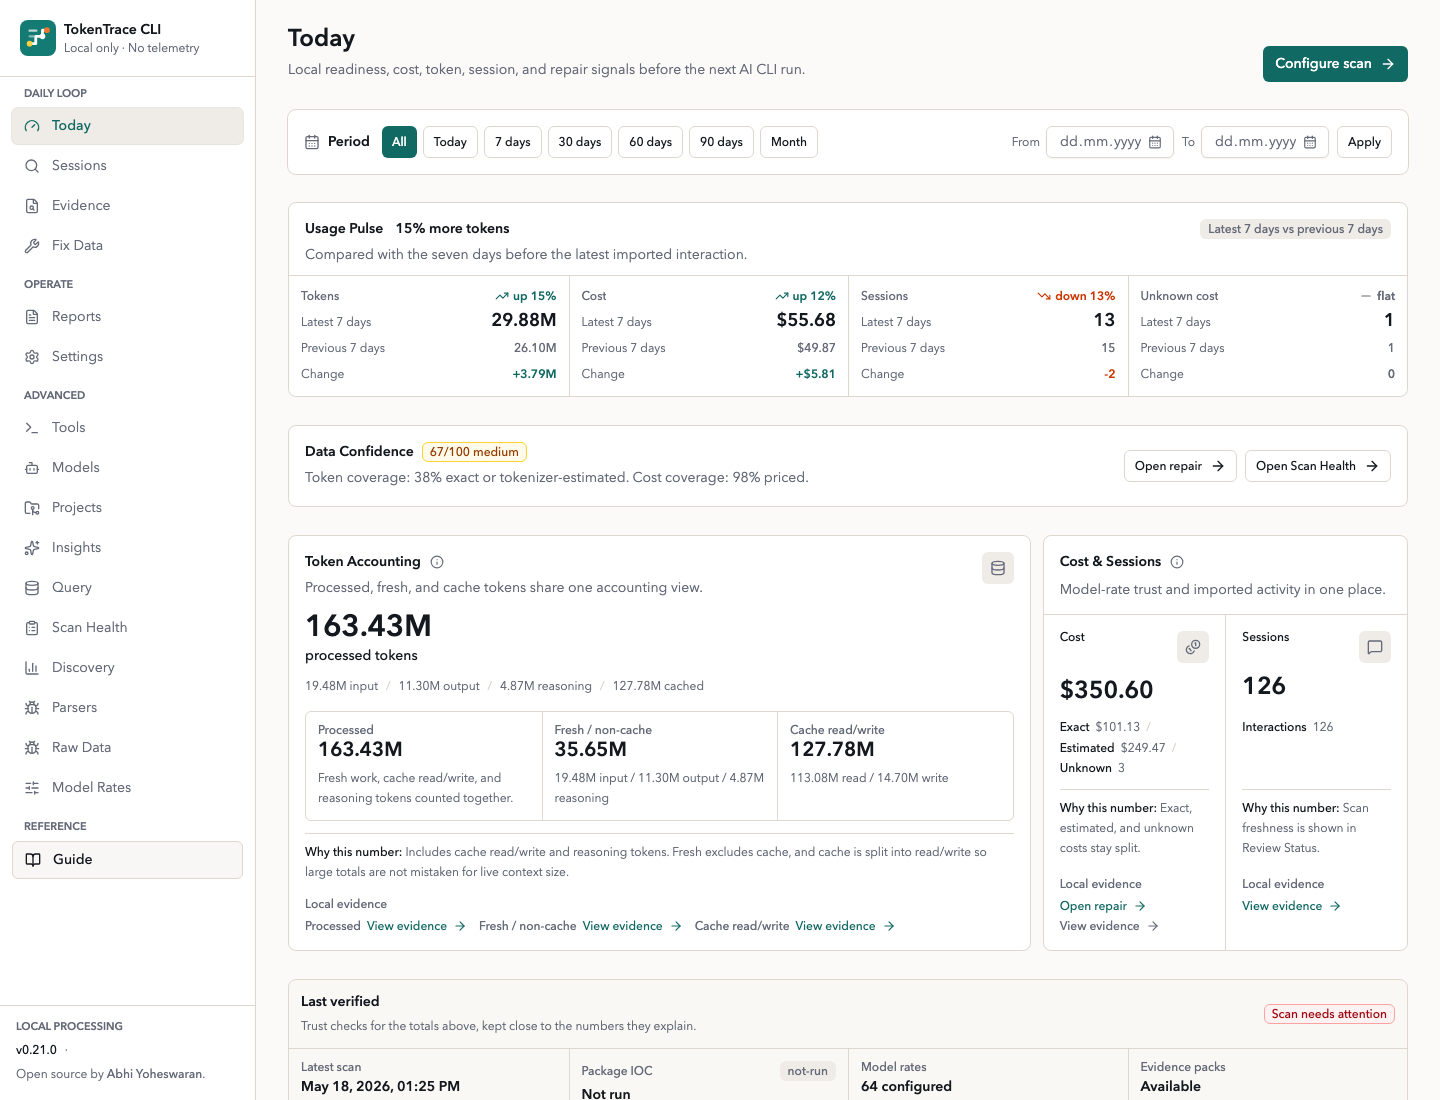
TokenTrace answers one practical question before the next expensive AI CLI run: is your local usage evidence ready to trust? It scans local Claude Code, Codex, structured usage logs, and usage-shaped local databases, then labels token and cost data as exact, estimated, unknown, cached, or non-cache. The dashboard opens on Today, with direct paths into Sessions, Evidence, and Fix Data.
TokenTrace is designed for local development machines first, with macOS-oriented defaults. It does not require a cloud account and does not send telemetry or logs anywhere.
What TokenTrace Helps You Do
- Check readiness before another coding-agent run with
tokentrace preflight --jsonor MCPget_preflight. - See today’s local cost, tokens, sessions, confidence, anomalies, and repair signals in one first screen.
- Trace every important number back to local files, parser state, sessions, model rates, and confidence labels.
- Fix missing cost data through a guided repair queue without uploading prompts or message bodies.
Start In Seconds
Run without installing:
npx tokentrace
Or install globally:
npm install -g tokentrace
tokentrace
The command starts the local dashboard, chooses an available localhost port starting at 3030, opens your default browser, and keeps the server running until you press Ctrl+C.
CLI commands:
tokentrace              # Start local dashboard
tokentrace serve        # Start local dashboard
tokentrace serve --port 3210 --no-open
                        # Start on a fixed port without opening a browser
tokentrace agent --json # Print machine-readable agent discovery manifest
tokentrace capabilities --json
                        # Alias for agent discovery manifest
tokentrace roadmap --json
                        # Print release status handoff
tokentrace mcp          # Start the local stdio MCP server
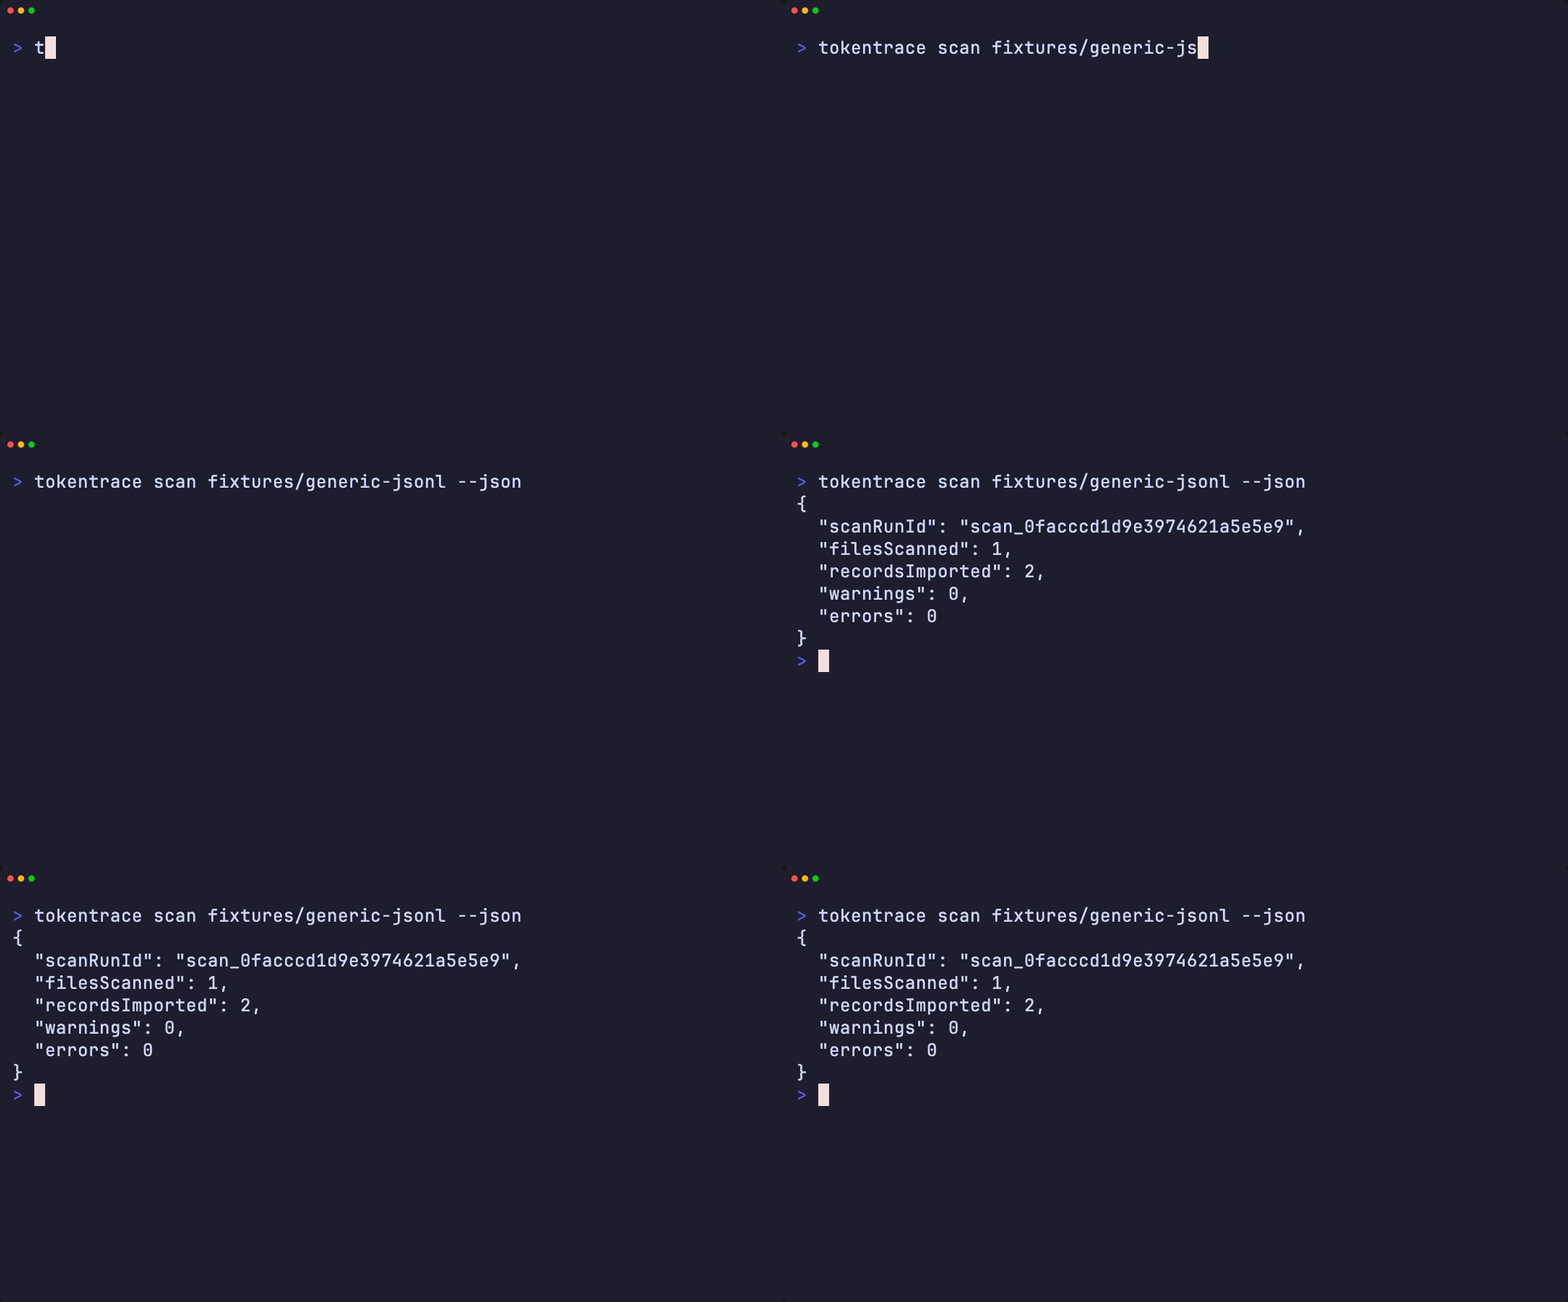
tokentrace scan         # Scan local AI CLI usage logs
tokentrace doctor --json
                        # Inspect scan health and repair recommendations
tokentrace preflight --json
                        # Check readiness before another coding-agent run
tokentrace evidence --json
                        # Print metric evidence trails as JSON
tokentrace repair --json
                        # Print unknown-cost repair groups as JSON
tokentrace digest --json
                        # Print current-month local usage digest
tokentrace digest --since yesterday
                        # Print a scoped local usage digest
tokentrace report --markdown
                        # Print a deterministic Markdown report
tokentrace review --json
                        # Print post-session scan and review movement
tokentrace insights --json
                        # Print local recommendations as JSON
tokentrace status --json
                        # Print local usage status as JSON
tokentrace statusline claude
                        # Render a Claude Code status line from stdin
tokentrace statusline claude --compact
                        # Render a shorter Claude Code status line
tokentrace statusline setup claude
                        # Print Claude Code statusLine setup JSON
tokentrace watch --session
                        # Watch local usage status in a terminal split
tokentrace watch --session --compact
                        # Watch a compact live status line
tokentrace pricing refresh
                        # Refresh public model prices
tokentrace run <cmd>    # Optional wrapper mode for command runtime diagnostics
tokentrace reset        # Reset imported local data
tokentrace reset --yes  # Reset without confirmation
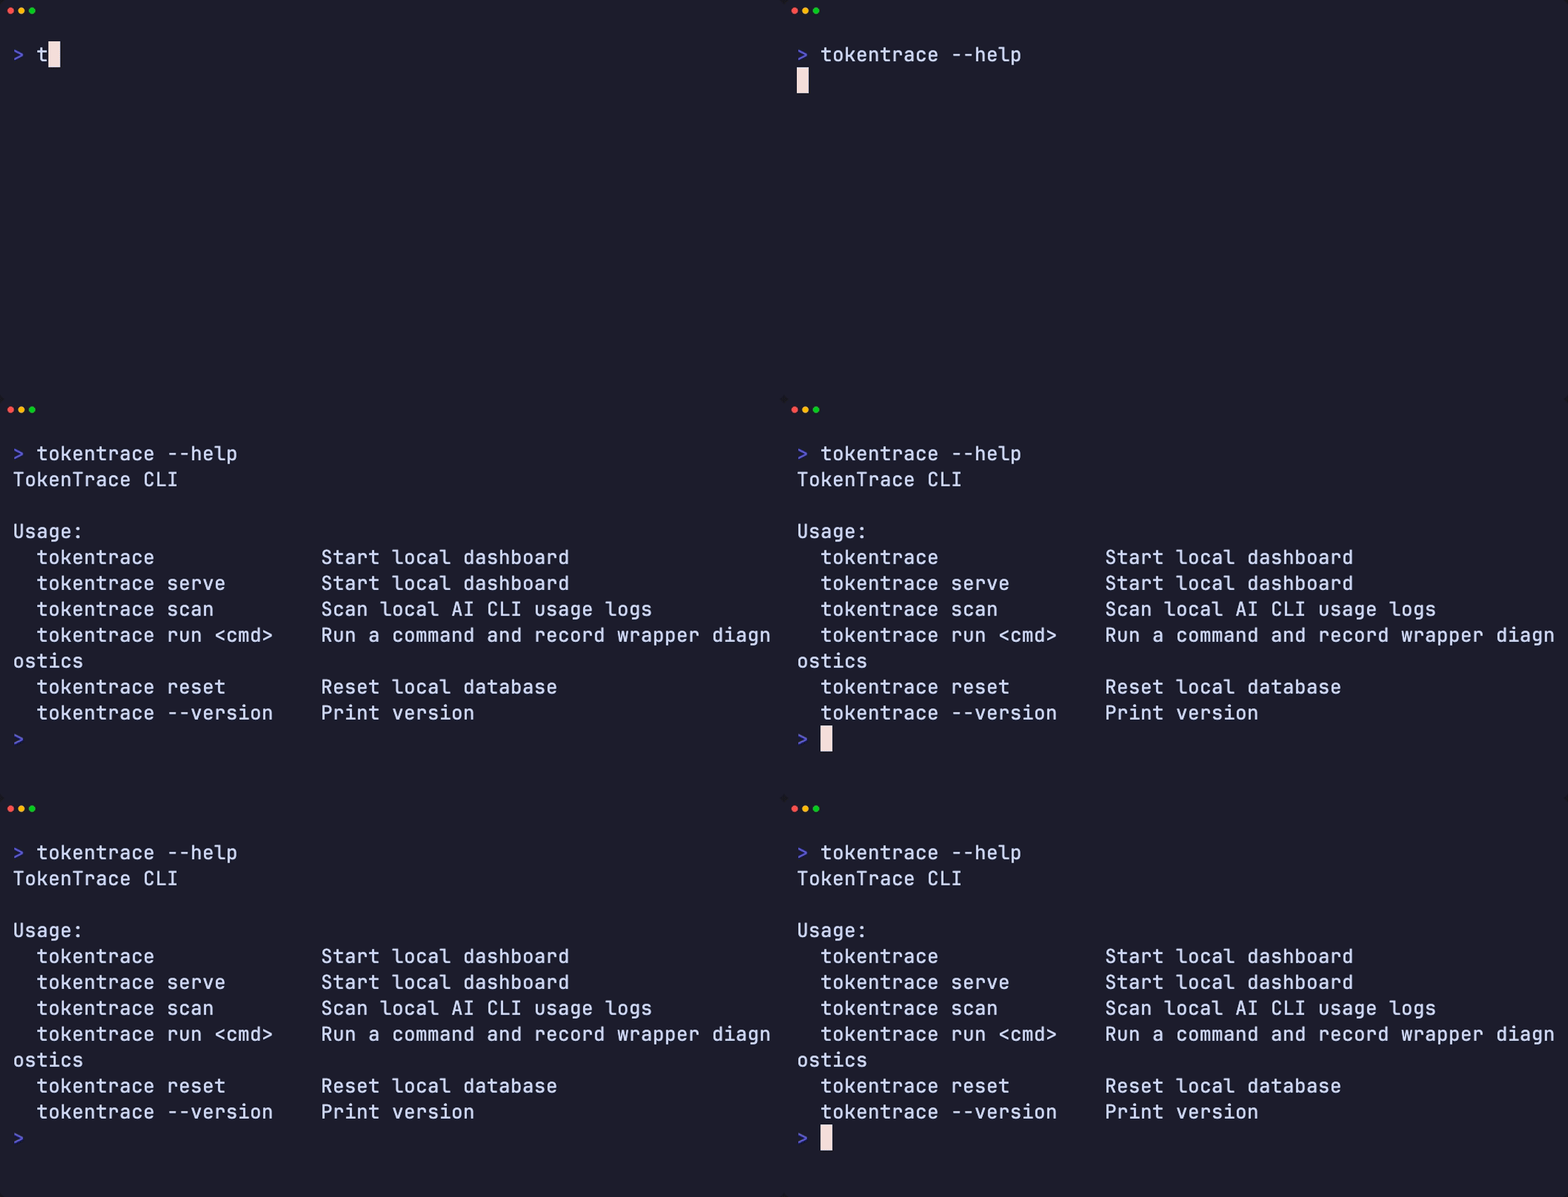
tokentrace --help       # Print help
tokentrace --version    # Print version
For Coding Agents
Agents should start with the read-only discovery manifest:
tokentrace agent --json
The alias below returns the same manifest:
tokentrace capabilities --json
The manifest describes TokenTrace's local-first privacy model, safe JSON commands,
common workflows, Claude Code status-line setup, Codex sidecar fallback, and
guardrails such as never running tokentrace reset without explicit human
approval. The discovery command does not scan files, initialize the database, or
start the dashboard.
Package-level agent references are included for agents that inspect repository or npm package contents before invoking commands:
MCP-capable clients can start the local stdio server after installing or using the npm package:
tokentrace mcp
Registry name: io.github.abhiyoheswaran1/tokentrace.
First MCP call for agents: get_agent_guide.
Self-test the local MCP entrypoint without scanning files:
tokentrace mcp selftest --json
The MCP server exposes the same local-first surfaces as tools: capabilities,
preflight, status, Scan Health, evidence, repair queue, reports, and an
explicit scan tool. It does not scan files on startup, and its scan tool requires
confirmLocalScan=true before reading local usage files or writing the local
database.
Before starting another long coding-agent run, use preflight:
tokentrace preflight --json
In MCP clients, call get_preflight for the same proceed, caution, or blocked
decision with local scan freshness, confidence, guardrail, anomaly, and repair
findings. Preflight does not scan files or inspect raw prompts.
When the local dashboard is already running, agents can fetch the same manifest over localhost:
curl http://127.0.0.1:3030/api/agent
curl http://127.0.0.1:3030/api/capabilities
The Local Sources & Trust release handoff is also machine-readable:
tokentrace roadmap --json
curl http://127.0.0.1:3030/api/roadmap
Run From Source
npm install
npm run db:migrate
npm run db:seed
npm run dev
Open http://localhost:3000.
Useful source commands:
npm run dev          # Start the Next.js dev server
npm run build        # Build the production app
npm run start        # Serve the production build
npm run scan         # Scan default and configured folders
npm run db:migrate   # Create/update local SQLite tables
npm run db:seed      # Seed editable provider/model prices
npm run screenshots:seed
                    # Seed a guarded public-safe screenshot database
npm run reset        # Clear imported data and scan history
npm test             # Run parser and cost tests
npm run verify       # Run Vitest, TypeScript, and ESLint checks
npm run package:test # Verify, build, and dry-run the npm package
npm run package:inspect
                    # Check package transparency guardrails
npm run security:ioc
                    # Scan lockfiles, workflows, and local AI-tool hooks for supply-chain IOCs
npm run smoke:packed
                    # Inspect packed tarball and smoke test packed CLI
tokentrace roadmap --json
                    # Inspect roadmap handoff, action recipes, and release status
Daily Loop And Trust
TokenTrace now organizes the product around the daily loop:
- Preflight: decide whether local evidence is ready before another agent run.
- Today: review cost, token, session, confidence, anomaly, and repair signals.
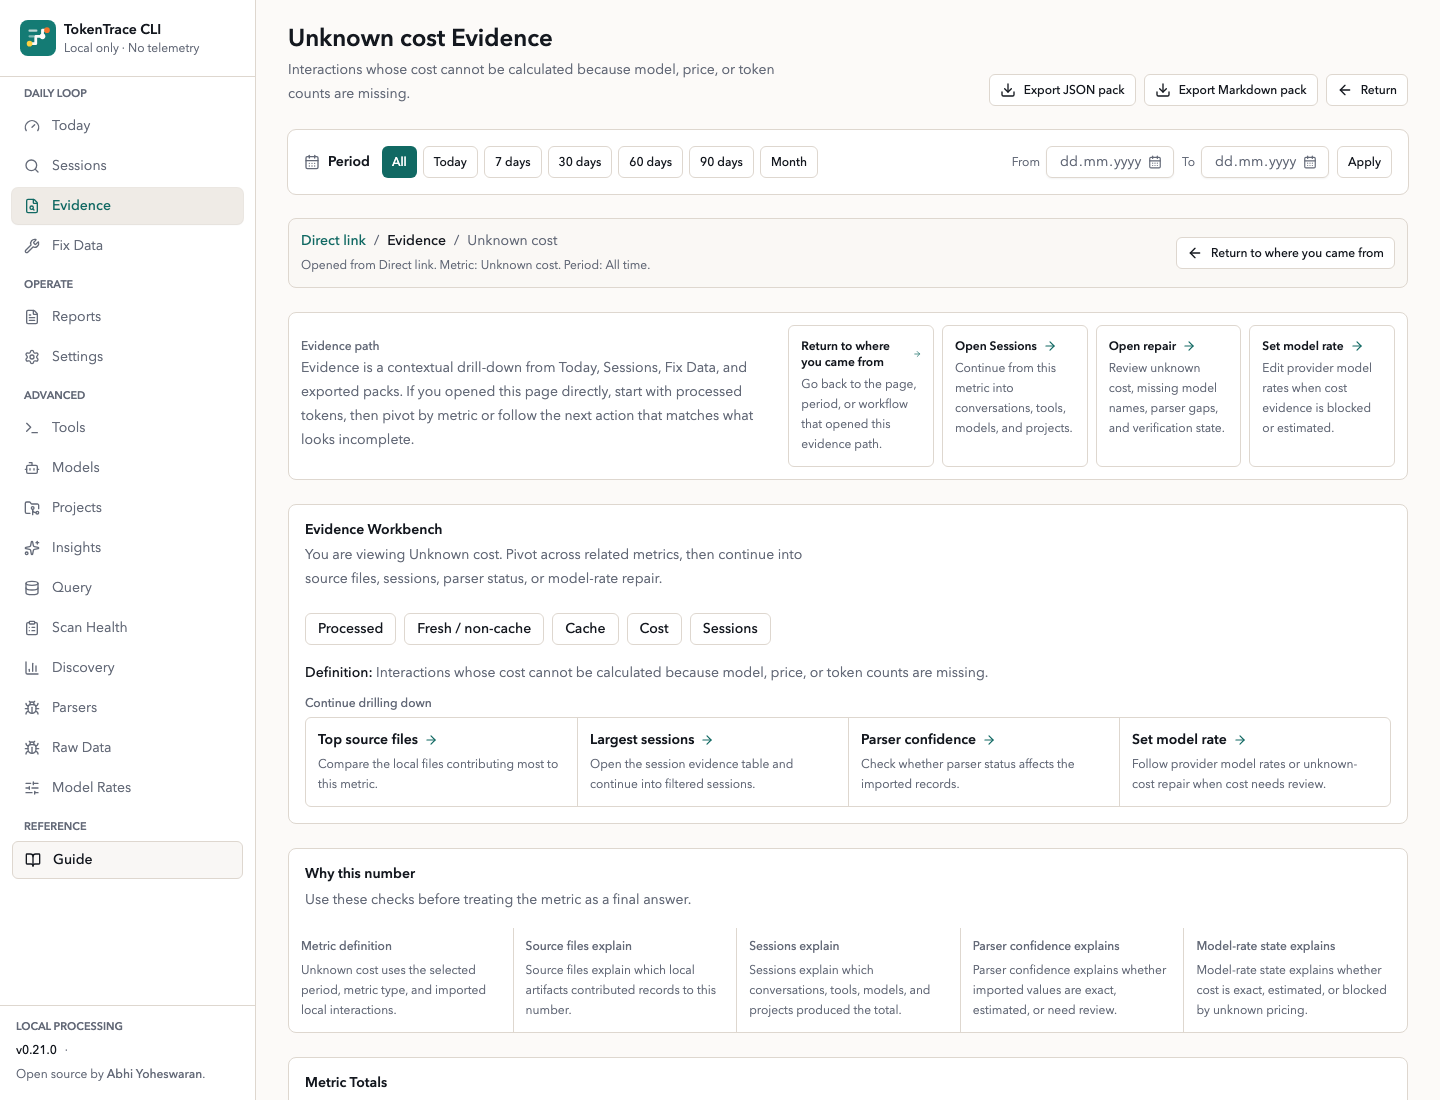
- Evidence: trace numbers back to source files, parser confidence, sessions, and model-rate state.
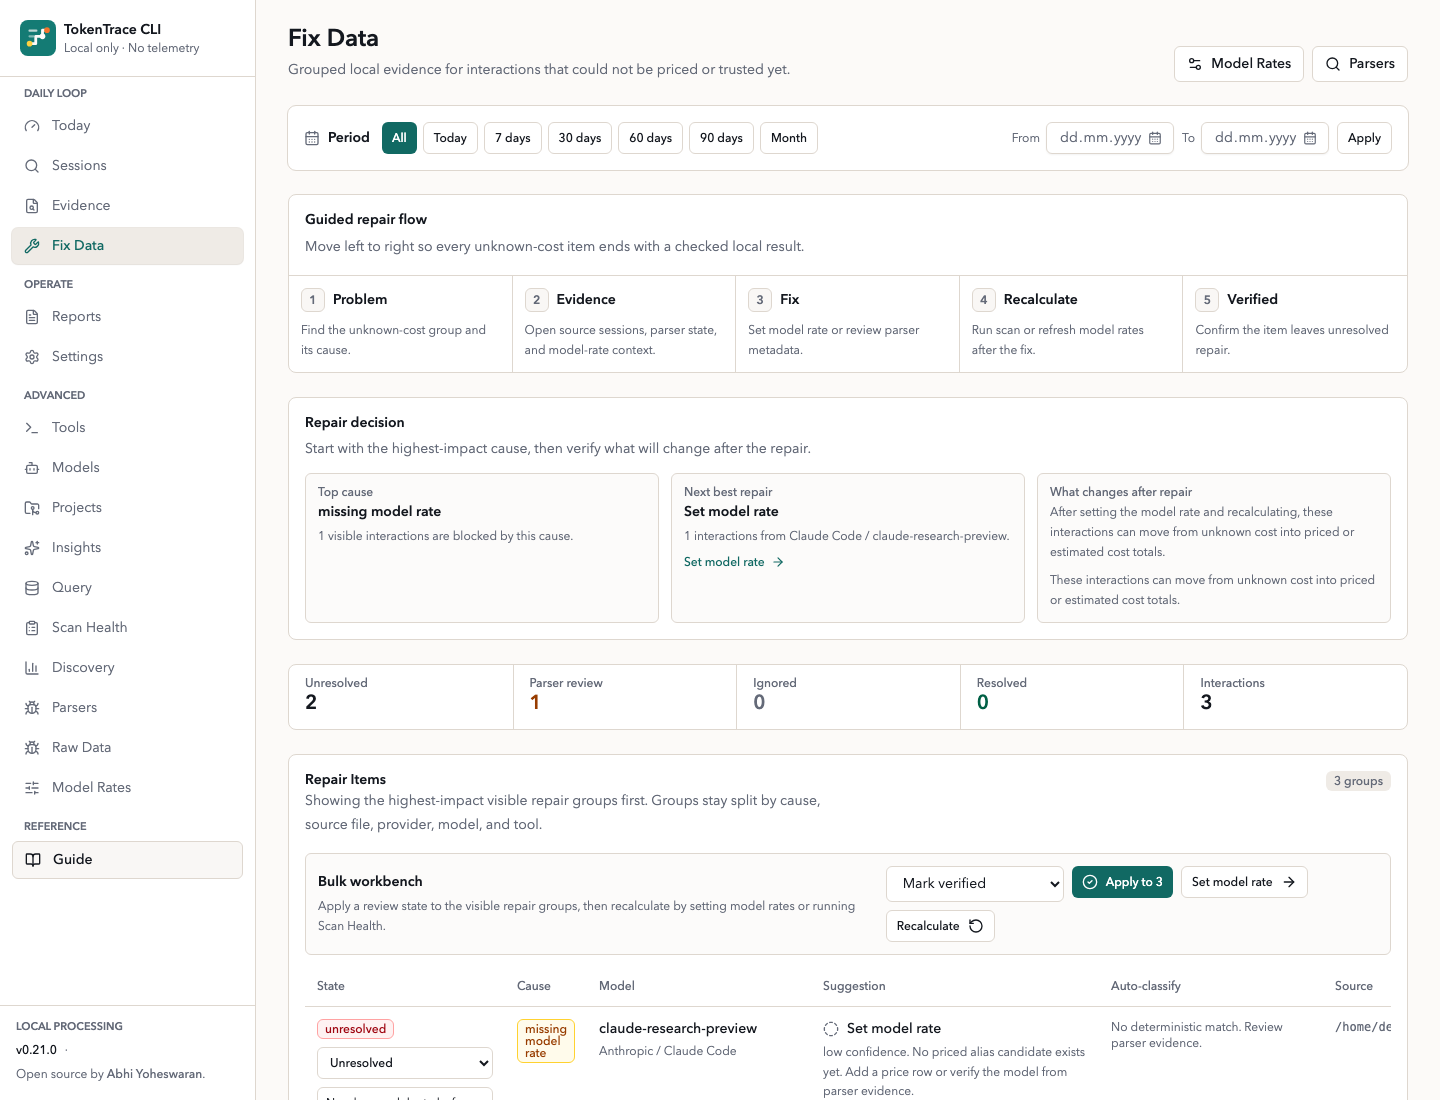
- Fix Data: resolve unknown cost, parser review, and model-rate gaps.
- Advanced: inspect Scan Health, Discovery, Parsers, Raw Data, Query, and Model Rates when you need the full diagnostic surface.
Trust surfaces include:
- native structured usage log and Cursor-style chat export ingestion
- Source Coverage in Scan Health for native, profile-assisted, fallback, and unsupported files
- privacy-safe Evidence Packs as JSON or Markdown
- local scan scheduling: manual, on-open, hourly, or daily
- project/model/tool scoped guardrails with warning thresholds
- Import Profile preview before saving matchers
- saved report exports for weekly usage, source coverage, guardrails, unknown cost, high-cost sessions, and confidence trends
- operating metadata export without raw usage records
Accuracy And Evidence
TokenTrace labels the trust level behind imported numbers:
- exact provider token counts
- tokenizer estimates for recognized OpenAI/Codex and Claude-family model names
- simple estimates when only text-like content is available
- source-provided costs from local SQLite histories
- unknown cost repair groups when model, token, or rate evidence is missing
The dashboard surfaces a Data Confidence score on Today, Projects, Sessions, and Session Timeline pages. Scan Health also includes a supply-chain IOC check so package trust is visible in the product, not only in release scripts.
Public releases require maintainer approval. See docs/RELEASE_CHECKLIST.md before bumping versions, tagging, creating GitHub releases, or publishing npm.
In local development, the SQLite database defaults to .tokentrace/tokentrace.db. Override it with:
TOKENTRACE_DB=/absolute/path/tokentrace.db npm run dev
Data Location
When installed from npm, TokenTrace stores runtime data outside the package folder:
- macOS:
~/Library/Application Support/TokenTrace/ - Linux:
~/.local/share/tokentrace/ - Windows:
%APPDATA%/TokenTrace/
The CLI sets TOKENTRACE_DB and DATABASE_URL automatically. You can override the base directory with:
TOKENTRACE_HOME=/custom/path tokentrace
Where TokenTrace Looks
Default discovery checks these locations when present:
~/.claude/~/.config/claude/~/.codex/~/.config/codex/~/.openai/- Project-level hidden folders such as
.claude,.codex,.openai, and.aiin the directory wheretokentracewas invoked - TokenTrace wrapper logs in the local app-data directory
- Any custom folders configured in Settings
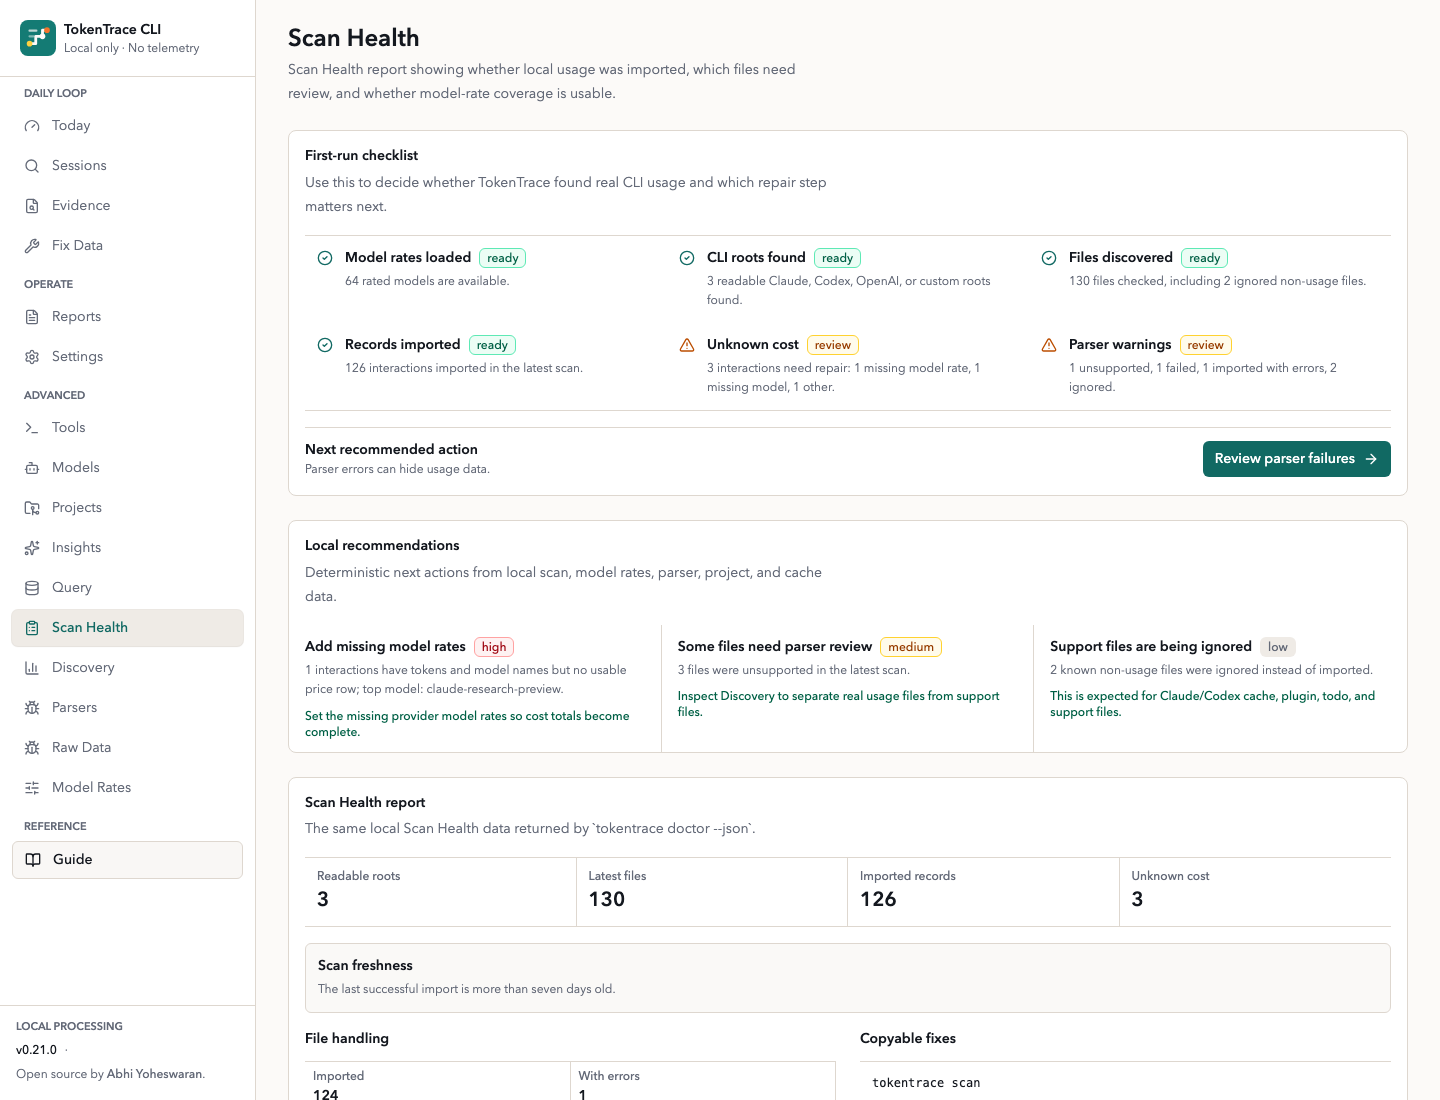
Use Settings to add custom folders, toggle raw message storage, and trigger scans. Use Scan Health, Discovery, Parsers, and Raw Data to inspect discovered files, parser decisions, warnings, failures, extracted metadata, and confidence levels.
Settings also supports optional local monthly usage guardrails. Set a cost limit, token limit, or both, and Today will show month-to-date progress from imported local CLI usage.
Sessions includes built-in and local saved views for recurring review paths: unknown cost, high-cost sessions, Claude/Codex this month, estimated tokens, guardrail review, and parser review. Open a session's Timeline link to see ordered interactions, model changes, token spikes, cache activity, tool calls, parser confidence, and unknown-cost events. Raw prompts and message bodies stay hidden by default.
Ingestion Architecture
TokenTrace's primary ingestion architecture is direct local filesystem ingestion:
- Discover local AI CLI artifacts.
- Parse supported formats through adapters.
- Normalize sessions, interactions, token usage, models, projects, and tool calls.
- Store normalized records locally in SQLite.
- Visualize analytics in the local dashboard.
TokenTrace does not use MITM proxies, packet sniffing, browser extensions, traffic interception, or cloud telemetry.
Each adapter detects compatibility, parses partial metadata where possible, and fails safely when a file format is unsupported. Imported interactions carry token confidence metadata:
exacthigh-confidence estimatelow-confidence estimateunknown
Exact and estimated token values are never mixed silently.
Optional Wrapper Mode
Filesystem ingestion is the primary product path. Wrapper mode is secondary and optional:
tokentrace run claude-code
tokentrace run codex
tokentrace run npm test
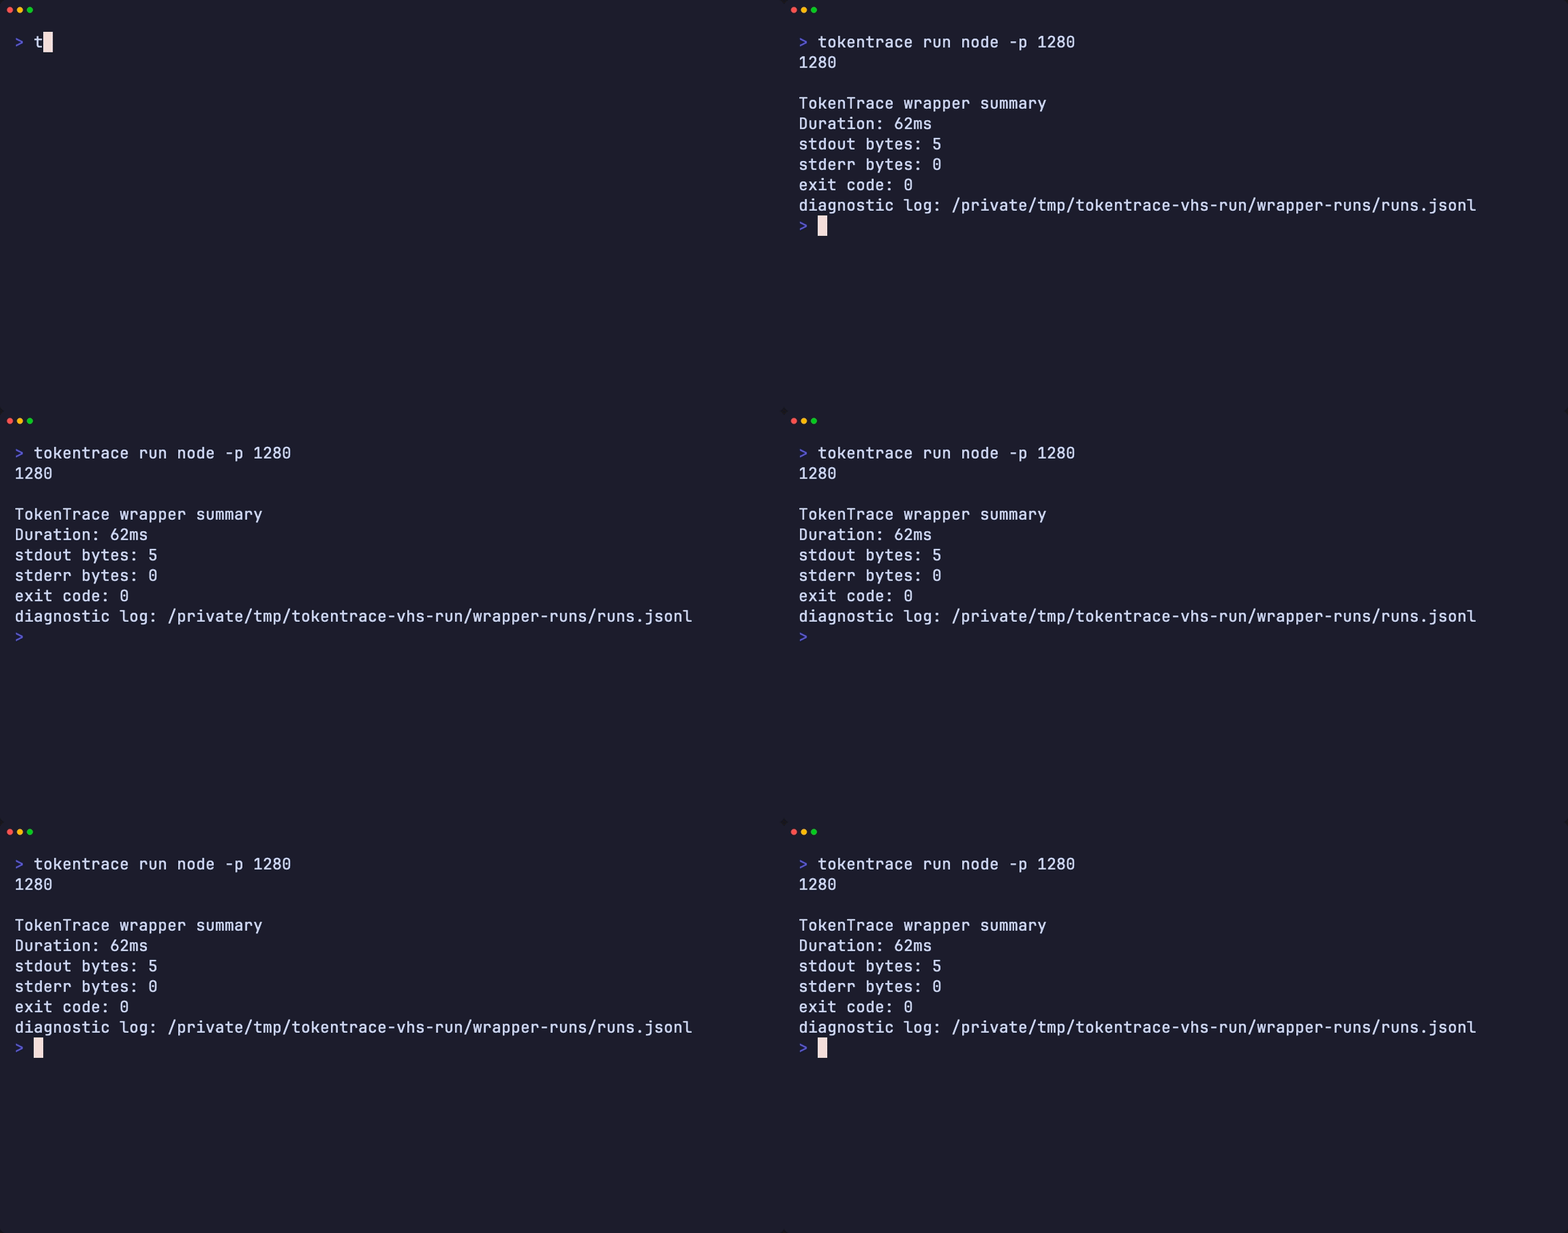
Wrapper mode launches the subprocess, measures duration, counts stdout/stderr bytes, detects structured JSON output when available, and writes a local JSONL diagnostic log under the app-data directory. It does not intercept network traffic.
Claude Code Status Line
Claude Code can run a local status-line command at the bottom of its terminal UI. TokenTrace supports that path directly:
tokentrace statusline setup claude
Add the printed statusLine block to ~/.claude/settings.json. It points Claude Code at:
tokentrace statusline claude
Claude Code sends session JSON to the command on stdin. TokenTrace reads the transcript path, model, context usage, and session cost, then prints one compact local line:
TokenTrace | Opus | ctx 7% | cost $0.1235 | processed 3.3K tokens | cache 2.0K | priced
Do not set the Claude Code statusLine.command to plain tokentrace. Plain tokentrace starts the dashboard, while tokentrace statusline claude prints exactly one status-line response.
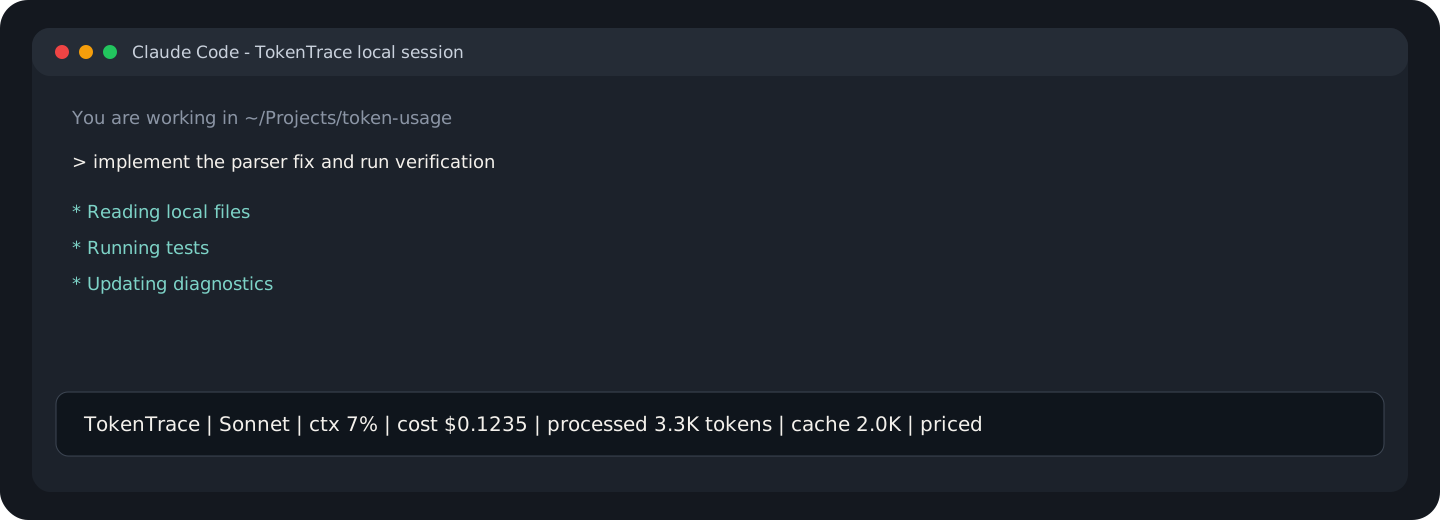
You can also inspect the same local status outside Claude Code:
tokentrace status --json
tokentrace watch --session
Daily reporting commands stay deterministic and local:
tokentrace digest --since last-scan
tokentrace digest --since 2026-05-01 --json
tokentrace report --markdown --since yesterday
tokentrace review --json
Codex CLI status-line integration is intentionally deferred until its status-line and hook contracts are stable enough to support without fragile terminal output parsing. Use tokentrace watch --session --compact in a terminal split or tmux pane as the current fallback. See docs/CODEX_INTEGRATION_SPIKE.md for the current decision.
Screenshots
Dashboard views:
CLI startup and help:
Local scan output:
Optional wrapper diagnostics:
Privacy Model
- All processing runs locally on your machine.
- No external telemetry is included. Next.js telemetry is disabled by the CLI.
- No cloud account is required.
- Raw full prompts and responses are not stored by default.
- TokenTrace stores short text previews for debugging and analytics context.
- TokenTrace may download a public model-pricing manifest so cost estimates stay useful. It does not send usage logs, prompts, file paths, or analytics data with that request. Set
TOKENTRACE_DISABLE_PRICE_REFRESH=1to use only bundled prices. - Turn on Store raw message content in Settings only if you want full local message text preserved in SQLite.
Stop the server with Ctrl+C in the terminal where tokentrace is running.
Package Trust
- The TokenTrace npm package has no
preinstall,install, orpostinstallscripts. - The published package ships readable application source and the compiled CLI runtime, not generated
.next/serverroute bundles. tokentrace serveprepares the local dashboard build in the user's TokenTrace app-data directory the first time it is needed.npm run package:inspectfails if generated Next.js build output appears in the published tarball.npm run security:iocscans lockfiles, workflows, and local Claude/VS Code hook files for high-signal supply-chain compromise indicators.- Public npm publishing is configured through GitHub Actions Trusted Publishing and provenance from version tags.
- Socket GitHub checks and ProjScan are used as release guardrails, alongside
npm audit --audit-level=moderate. npm run release:checkfails when a gate command exits non-zero. The import graph is expected to remain free of circular dependencies;tests/import-boundaries.test.tsprotects shared type/helper modules from importing higher-level orchestration barrels.- Release notes are published directly in GitHub Releases from the relevant changelog section, not as a link-only summary.
See SECURITY.md for the full security and privacy model.
Model Rates
Model prices change. TokenTrace ships with bundled public list prices and can refresh them from a public TokenTrace model-rate manifest. Manual edits made in Model Rates are preserved by future refreshes.
The bundled catalog includes common OpenAI, Anthropic, Google Gemini, xAI, DeepSeek, Mistral, and Cohere models, checked on May 8, 2026.
Seed sources:
- OpenAI API pricing and OpenAI model docs
- Anthropic Claude pricing
- Gemini Developer API pricing
- xAI models and pricing
- DeepSeek models and pricing
- Mistral model docs
- Cohere pricing
Review and update rates in Model Rates before treating cost estimates as financial truth, especially if you use batch processing, priority/flex modes, data residency, long-context surcharges, subscriptions, or provider-specific discounts.
Refresh from the dashboard or from the CLI:
tokentrace pricing refresh
Cost is calculated per interaction:
inputTokens * inputPricePer1M / 1,000,000
+ outputTokens * outputPricePer1M / 1,000,000
+ cacheReadTokens * cachedInputPricePer1M / 1,000,000
+ cacheWriteTokens * cacheWritePricePer1M / 1,000,000
Cache read and cache write prices fall back to input price when a model has no separate cache rate. Anthropic seed rows use the 5-minute prompt cache write price by default. Rows are marked exact, estimated, or unknown depending on token availability and pricing configuration.
Supported Inputs
Adapters live under src/ingestion/adapters/:
claude-code.tscodex-cli.tsstructured-usage-log.tscursor-chat.tssqlite-history.tsgeneric-jsonl.tsgeneric-json.tsgeneric-log.ts
Formats for Claude Code and Codex CLI can vary across versions, so these adapters are defensive and best-effort. Unknown files fail safely and show warnings in the Raw Data page.
Support Matrix
TokenTrace keeps a visible support contract so daily scans are easier to trust:
| Surface | Support level | Notes |
|---|---|---|
| Claude Code project transcripts | Stable | Primary local CLI ingestion source. |
| Codex CLI session artifacts | Best-effort | Parsed defensively while CLI formats evolve. |
| Structured usage JSONL/NDJSON | Stable | Local wrapper and team logs with session, model, token, and source-cost fields. |
| Cursor-style chat exports | Best-effort | Imports local editor chat/composer exports without storing raw prompt text by default. |
| Usage-shaped SQLite histories | Best-effort | Reads local databases that expose session, model, token, or cost-like columns. |
| Generic JSONL, JSON, and text logs | Best-effort | Conservative usage-shaped records only. |
| Claude/Codex cache, plugin, todo, config, and support files | Ignored | Tracked as non-usage files, not parser failures. |
| Editable model pricing | Stable | Local pricing rows drive costs and unknown-cost repair queues. |
| Claude Code status line | Stable | Uses Claude Code's documented statusLine stdin contract. |
| Codex sticky status line | Best-effort fallback | Use tokentrace watch --session --compact in a split or tmux pane. |
| Desktop app scraping, browser extensions, proxying, packet capture, telemetry | Unsupported | Outside TokenTrace's product boundary. |
Extending Parsers
Example generic JSONL fixtures are in fixtures/generic-jsonl/.
The ingestion system is intentionally pluggable:
- Add an adapter implementing
IngestionAdapter. - Register it in
src/ingestion/adapters/index.ts. - Add parser tests under
tests/.
Contributing
Contributions are welcome. See CONTRIBUTING.md for local setup, parser guidelines, pricing update notes, and the release policy.
Troubleshooting
prebuild-install deprecation warning during install
npm warn deprecated prebuild-install@7.1.3: No longer maintained...
This is a transitive dependency of better-sqlite3 (the native SQLite driver TokenTrace uses to store local data). The warning is harmless — the install completes normally and TokenTrace runs as expected. It will go away once better-sqlite3 upstream migrates to a different prebuilt binary loader; there is nothing to fix on the TokenTrace side.
Native build errors on better-sqlite3
If the prebuilt binary cannot be downloaded (offline machine, restrictive proxy, unsupported Node ABI), better-sqlite3 will try to compile from source and may fail. Workarounds:
- Ensure Node.js is a supported LTS (TokenTrace requires
>= 20.0.0; Node 20 or 22 LTS is recommended). - Install build tools: Xcode Command Line Tools on macOS,
build-essentialandpython3on Linux, or the "Desktop development with C++" workload on Windows. - Retry the install with network access to
github.comso the prebuilt binary can be fetched.
EBADENGINE warnings
These appear when your local Node version is older than the engines field of a transitive dependency. They are warnings, not errors. Upgrading to the latest Node LTS resolves them.
Known Limitations
- Claude Code and Codex CLI log formats are inferred defensively and may need refinement with real sample logs.
- Tokenizer-backed estimates are available for recognized OpenAI/Codex and Claude-family model names. Unrecognized text-only records still fall back to a conservative simple estimate.
- SQLite-history ingestion expects usage-shaped local tables and skips arbitrary databases that do not expose session, model, token, or cost-like fields.
- Seed prices are editable and should be verified manually for your account, region, and provider plan.
License
Open source by Abhi Yoheswaran. Released under the MIT License. See LICENSE.
Next Improvements
- Expand first-class native adapters for more local AI tools and editor histories.
- Add provider-specific tokenizer refinements where public tokenizer behavior is stable enough to label clearly.
- Make Import Profile preview more interactive for teams with custom wrapper logs.
- Stream scan progress into the UI for very large local folders.